Content Attributes
In the competitive business world, only those businesses tend to survive and grow that are able to make the best use of their data. Today’s marketing world revolves around the word “Big data”. And the organizations that implement the right processes and tools to integrate all their data from multiple source systems into an efficient data warehouse are the ones to thrive.
Business data is scattered across web feeds, flat files, databases, cloud storage, and other offline applications. No matter where your data lies, you can now effectively connect with any data source using Zoho Analytics and further perform in-depth reporting and analysis. With Zoho Data Analytics, you can automate the data syncing and schedule the same as required.
In this article, we will learn about Zoho Analytics and how its features can help data-driven organizations go a long way.
What is Zoho Analytics?
Zoho Analytics (previously known as Zoho Reports) is a BI and analytics platform, available on the on-premise and cloud. That helps startups to multinational organizations derive valuable insights from their business data.
It provides users the ability to create visualizations and dashboards to present their data in an easy-to-understand manner. With better visualizations, you can get better insights into the organization’s business data and help different departments to predict market changes and act accordingly.
With Zoho analytics integrations, users can break big chunks of data into a clean and structured format. So that it can be used to perform several analytical tasks and better decision-making. In Zoho Analytics, you can easily create and share powerful reports within minutes, without any coding or IT help.
Features of Zoho Analytics
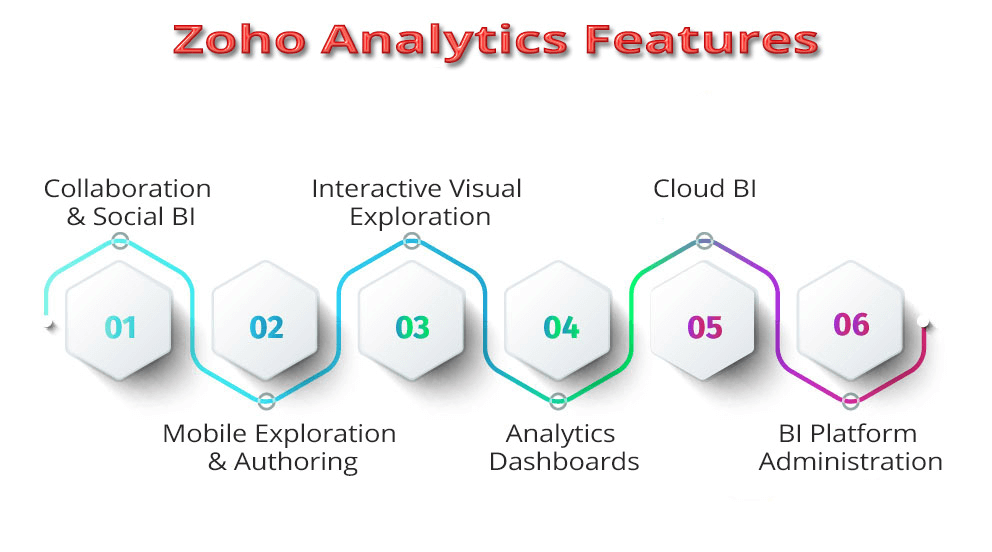
- A range of visualization: The analytics platform offers you a range of visualization like charts, pivot tables, widgets, and tabular view components. That allows users to create insightful reports and dashboards.
- Drag & drop interface: Make creating visualization an easy task with Zoho Analytics’ smooth drag & drop interface. The platform has an intuitive drag-and-drop interface that makes powerful report generation an easy and quick task, without the need for code. Dig deeper into your organizational data and gain insights that can provide you with a competitive advantage.
- Geo Visualization: With geo-visualization, the sales department of your organization can instantly compare the regional performance with interactive map charts. It becomes easy to compare performance across international borders, states, counties, and more.
- Data Alerts: In Zoho Analytics, users can set an automated alert that notifies them whenever there is a major change in the data.
- Report Scheduling: This feature of the Zoho platform allows users to schedule reports publishing and sharing via email. Even recurring reports can be scheduled to generate on a set time and date.
- White Labeling: The feature facilitates embedding into applications or websites. The technology is designed to embed reports or dashboards individually.
- Data Connectors: With these data connectors, you can easily connect to any data source, including data feeds, files, databases, cloud storage, CRM systems, marketing platforms, Google Analytics, social media, e-commerce platforms, financial platforms, and much more.
- Ask Zia: It is a smart analytical assistant backed by AI and machine learning algorithms. Users can type questions in natural query language (NQL), and the assistant will answer them via reports or will source KPI widgets.
- Mobile Support: The Apps for Android and iOS mobile help users view reports and dashboards from their smartphones and keep an eye on operations from anywhere and anytime.
- Auto-Joined Data: This feature automatically merges tables that are linked by a Lookup column.
Benefits of Zoho Analytics
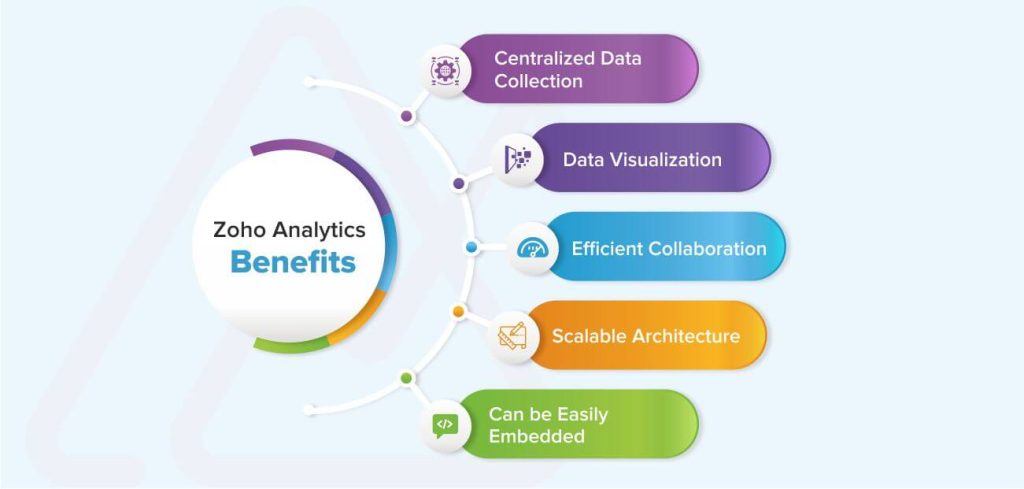
- Data Visualization in Intuitive Graphics: With Zoho Analytics, get started with creating useful, insightful dashboards and gain valuable information to fuel your decisions. The platform allows you to choose from a variety of visualizations that can present your business data in an impressive way.
- Perform in-depth analysis: Users can perform an in-depth analysis that boosts their business intelligence through powerful features such as functions that identify business metrics, pre-built formulas, and smart forecasting to anticipate future outcomes.
- Scales with your business: The Zoho Data Analytics platform has a scalable, extensible architecture. That helps users build and integrate analytics into every size application. The platform grows with the growing analytics needs of your business and assists you in handling large volumes of data easily and quickly.
- Integrate data from multiple sources: You can integrate data from multiple source systems, including outside ones. Into a single cohesive database to get a sneak peek into your customers’ behavior, financial status, business operations, and more.
Wrapping up
The Zoho Analytics platform is highly secure and supports backup, redundancy, and confidentiality & privacy of data. The competitive business world has made it necessary for every industry to incorporate a data integration and analytics platform. That supports them to keep track of their sales and customer interactions. This way, every marketing decision they make can fetch them great results and the highest ROI.