Content Attributes

In today’s fast-paced business environment, data analysis has become an integral part of decision-making processes. It helps businesses to make informed decisions based on real-time data and analytics. With the rise of big data, businesses now have access to vast amounts of data that can be leveraged to gain a competitive advantage. However, analyzing this data can be a daunting task without the right tools. In this blog, we will discuss the 6 best business data analysis tools in 2023 that can help businesses analyze their data and gain insights to make informed decisions.
Tableau
Tableau is a powerful data visualization and business intelligence tool that allows businesses to connect, analyze and share data in a visual and interactive format. With Tableau, businesses can quickly create and share interactive dashboards, charts, and graphs that help them to identify trends, patterns, and outliers in their data. The tool is easy to use and does not require any programming skills, making it accessible to users of all skill levels.
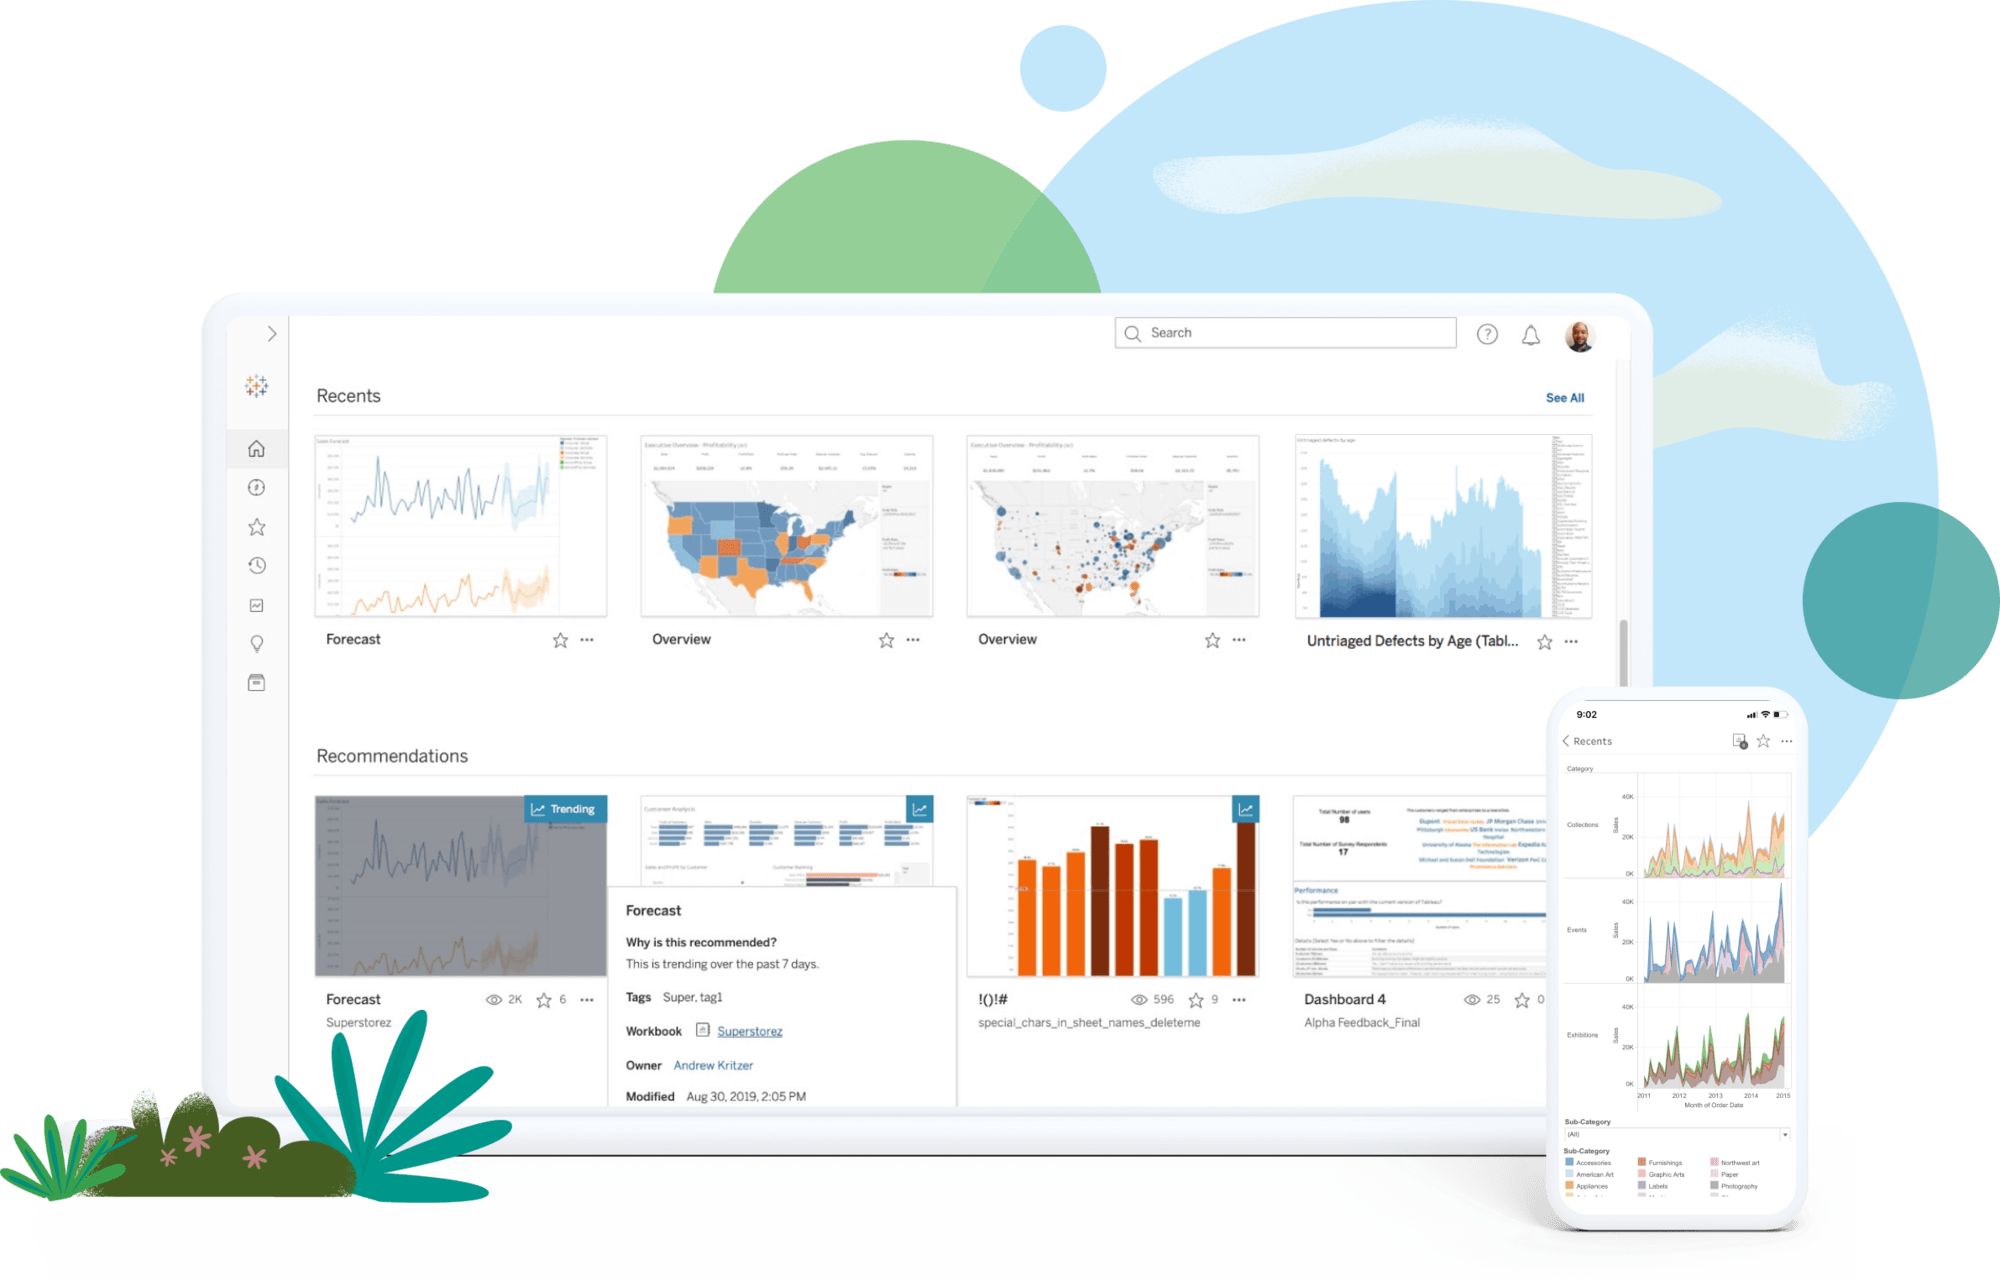
Tableau has a wide range of features, including data blending, mapping, and predictive analytics, that make it a versatile tool for business data analysis. It also has a large community of users who share knowledge and best practices, making it easier for businesses to get started with the tool.
Here are some key features, pros, and cons of using Tableau:
Features:
- Data visualization: Tableau allows users to create interactive and dynamic visualizations of their data, including charts, graphs, maps, and more.
- Data blending: Tableau enables users to combine data from different sources and create a single view of their data.
- Dashboards: Tableau allows users to create customizable dashboards that display key metrics and KPIs.
- Analytics: Tableau includes advanced analytics features, including forecasting, clustering, and statistical modeling.
- Mobile access: Tableau has a mobile app that allows users to access their data and visualizations from anywhere.
Pros:
- Easy to use: Tableau has an intuitive interface and requires little technical expertise to use.
- Powerful data visualization: Tableau’s data visualization capabilities are among the best in the industry, making it easy to create compelling visualizations of your data.
- Fast performance: Tableau’s in-memory processing engine allows for fast data analysis and visualizations.
- Flexibility: Tableau can connect to a wide range of data sources, including spreadsheets, databases, and cloud services.
- Community support: Tableau has a large and active community of users who share tips, tricks, and best practices.
Cons:
- Cost: Tableau can be expensive, especially for small businesses or individual users.
- Limited data manipulation: Tableau’s data manipulation capabilities are somewhat limited compared to other data analysis tools.
- Steep learning curve: While Tableau is easy to use for basic analysis, mastering the more advanced features can require significant time and effort.
- Limited customizability: Tableau’s customization options are somewhat limited compared to other data analysis tools.
- Large file sizes: Tableau workbooks can be large, which can make sharing and collaborating on visualizations challenging.
Power BI
Power BI is a cloud-based business intelligence tool that allows businesses to analyze and visualize their data using interactive dashboards, reports, and charts. The tool integrates with various data sources, including Excel, SQL Server, and SharePoint, making it easy for businesses to connect to their data.

Power BI has a wide range of features, including data modeling, data visualization, and predictive analytics, that make it a powerful tool for data analysis. It also has a large community of users who share knowledge and best practices, making it easier for businesses to get started with the tool.
Here are some key features, pros, and cons of using Power BI:
Features:
- Data visualization: Power BI allows users to create interactive and dynamic visualizations of their data, including charts, graphs, and maps.
- Data modeling: Power BI allows users to create data models and relationships between different data sources.
- Dashboards: Power BI enables users to create customizable dashboards that display key metrics and KPIs.
- Analytics: Power BI includes advanced analytics features, including forecasting, clustering, and statistical modeling.
- Collaboration: Power BI includes features that allow teams to collaborate on data analysis and share insights.
Pros:
- Integration with Microsoft products: Power BI integrates seamlessly with other Microsoft products, including Excel and Office 365.
- Scalability: Power BI can handle large datasets and can be scaled up as your business grows.
- Security: Power BI offers robust security features, including data encryption, user authentication, and access control.
- Customization: Power BI offers a high degree of customization, allowing users to create bespoke data models and visualizations.
- Community support: Power BI has a large and active community of users who share tips, tricks, and best practices.
Cons:
- Learning curve: Power BI can be complex, and it can take time to learn how to use all of its features.
- Limited data manipulation: Power BI’s data manipulation capabilities are somewhat limited compared to other data analysis tools.
- Cost: While there is a free version of Power BI available, some features are only available in paid versions, which can be expensive.
- Limited customizability: Power BI’s customization options are somewhat limited compared to other data analysis tools.
- Integration with non-Microsoft products: Power BI’s integration with non-Microsoft products can be challenging.
Google Analytics
Google Analytics is a free web analytics tool that allows businesses to track and analyze their website traffic. The tool provides businesses with insights into how users are interacting with their websites, including information on user behavior, demographics, and device usage.
Google Analytics has a wide range of features, including real-time data tracking, custom reports, and conversion tracking, that make it a powerful tool for analyzing website data. It also integrates with various Google tools, including Google Ads and Google Search Console, making it easy for businesses to track their online advertising and search engine optimization efforts.
Here are some key features, pros, and cons of using Google Analytics:

Features:
- Website tracking: Google Analytics allows users to track website traffic, visitor behavior, and other metrics.
- Real-time reporting: Google Analytics provides real-time reporting, allowing users to see how visitors are interacting with their website in real time.
- Goal tracking: Google Analytics enables users to set and track website goals, such as form submissions or e-commerce transactions.
- Customizable dashboards: Google Analytics allows users to create customizable dashboards to display key metrics and KPIs.
- Integration with other Google tools: Google Analytics can be integrated with other Google tools, such as Google Ads and Google Search Console.
Pros:
- Free: Google Analytics is free to use for most businesses, making it an affordable option for small and medium-sized businesses.
- User-friendly: Google Analytics has an intuitive interface and requires little technical expertise to use.
- Comprehensive reporting: Google Analytics provides a wealth of data and insights into website traffic and visitor behavior.
- Integration with other Google tools: Google Analytics can be integrated with other Google tools, allowing users to streamline their marketing and analytics efforts.
- Community support: Google Analytics has a large and active community of users who share tips, tricks, and best practices.
Cons:
- Limited data processing: Google Analytics may not be able to handle large amounts of data, and data processing can be slow for larger websites.
- Data accuracy: Google Analytics data may not always be 100% accurate, and certain factors, such as ad blockers, can affect tracking accuracy.
- Limited customization: Google Analytics customization options are somewhat limited compared to other web analytics tools.
- Data privacy: Google Analytics collects user data, which may raise privacy concerns for some users.
- Limited customer support: Google Analytics customer support is limited to online forums and documentation.
IBM Cognos Analytics
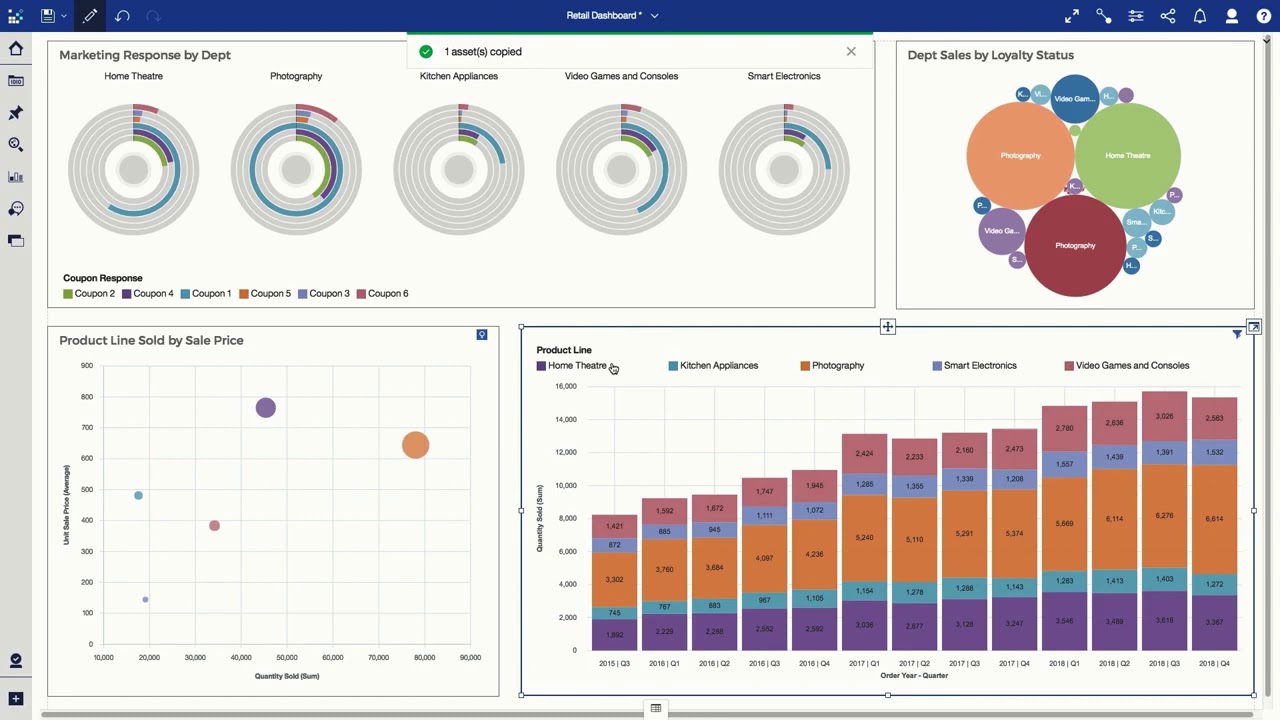
IBM Cognos Analytics is a business intelligence tool that allows businesses to analyze and visualize their data using interactive dashboards, reports, and charts. The tool provides businesses with insights into their data, including trends, patterns, and anomalies.
IBM Cognos Analytics has a wide range of features, including data modeling, data visualization, and predictive analytics, that make it a powerful tool for data analysis. It also has a large community of users who share knowledge and best practices, making it easier for businesses to get started with the tool.
Here are some key features, pros, and cons of using IBM Cognos Analytics:
Features:
- Data visualization: IBM Cognos Analytics allows users to create dynamic and interactive visualizations of their data, including charts, graphs, and maps.
- Data modeling: IBM Cognos Analytics enables users to create data models and relationships between different data sources.
- Dashboards: IBM Cognos Analytics provides customizable dashboards that display key metrics and KPIs.
- Analytics: IBM Cognos Analytics includes advanced analytics features, such as predictive analytics and machine learning.
- Collaboration: IBM Cognos Analytics has features that allow teams to collaborate on data analysis and share insights.
Pros:
- Scalability: IBM Cognos Analytics can handle large datasets and can be scaled up as your business grows.
- Customization: IBM Cognos Analytics offers a high degree of customization, allowing users to create bespoke data models and visualizations.
- Security: IBM Cognos Analytics provides robust security features, including data encryption, user authentication, and access control.
- Integration with other IBM tools: IBM Cognos Analytics can be integrated with other IBM tools, such as IBM Watson and IBM SPSS.
- Customer support: IBM Cognos Analytics provides comprehensive customer support, including phone and email support, as well as online resources and training.
Cons:
- Learning curve: IBM Cognos Analytics can be complex, and it may take time to learn how to use all of its features.
- Cost: IBM Cognos Analytics can be expensive, particularly for larger organizations or for those requiring advanced features.
- Limited data manipulation: IBM Cognos Analytics’ data manipulation capabilities are somewhat limited compared to other data analysis tools.
- Limited data sources: IBM Cognos Analytics may have limited connectivity options to certain data sources, depending on your organization’s technology stack.
- Limited community support: IBM Cognos Analytics has a smaller community of users compared to other data analysis tools, which may make it harder to find support or resources.
QlikView
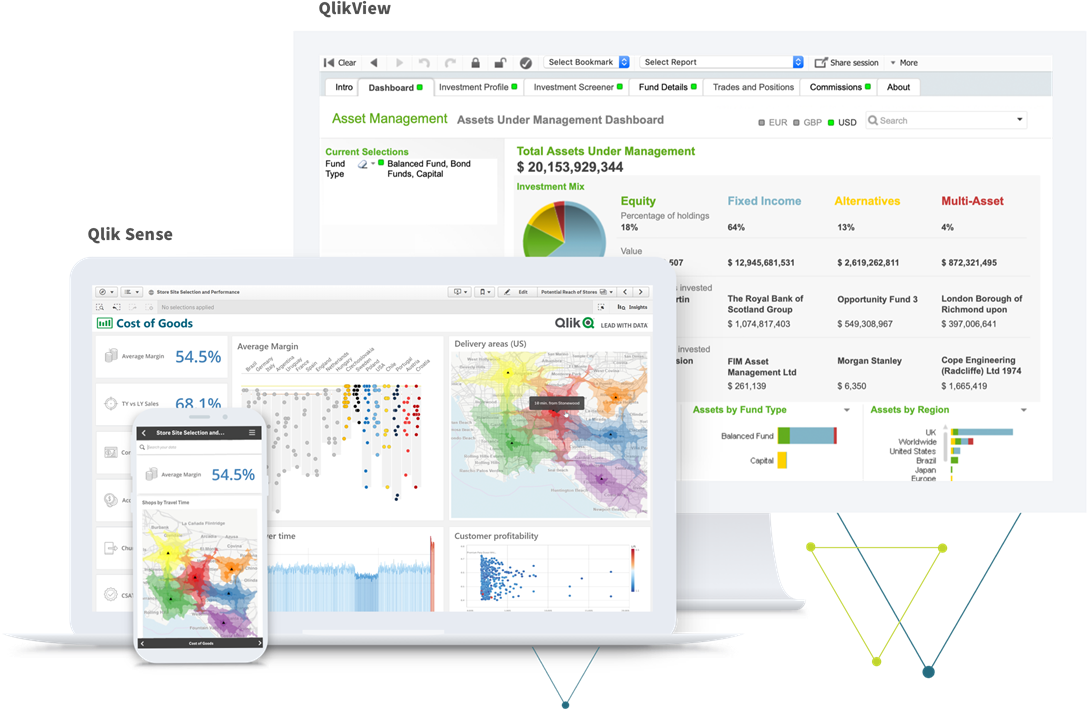
QlikView is a business intelligence tool that allows businesses to analyze and visualize their data using interactive dashboards, reports, and charts. The tool provides businesses with insights into their data, including trends, patterns, and outliers.
QlikView has a wide range of features, including data modeling, data visualization, and predictive analytics, that make it a powerful tool for data analysis. It also has a large community of users who share knowledge and best practices, making it easier for businesses to get started with the tool.
Here are some key features, pros, and cons of using QlikView:
Features:
- Data visualization: QlikView allows users to create interactive and dynamic visualizations of their data, including charts, graphs, and maps.
- Data integration: QlikView enables users to connect and integrate data from multiple sources, including databases, spreadsheets, and other applications.
- Data modeling: QlikView allows users to create data models and relationships between different data sources.
- Dashboards: QlikView provides customizable dashboards that display key metrics and KPIs.
- Analytics: QlikView includes advanced analytics features, such as predictive analytics and machine learning.
Pros:
- Scalability: QlikView can handle large datasets and can be scaled up as your business grows.
- User-friendly: QlikView has a user-friendly interface that makes it easy to create and modify visualizations and dashboards.
- Flexibility: QlikView allows users to create custom data models and visualizations to suit their specific needs.
- Fast data processing: QlikView’s in-memory data processing allows for fast and efficient data analysis.
- Community support: QlikView has a large community of users, which provides a wealth of resources, support, and training.
Cons:
- Cost: QlikView can be expensive, particularly for larger organizations or for those requiring advanced features.
- Limited data manipulation: QlikView’s data manipulation capabilities are somewhat limited compared to other data analysis tools.
- Limited data sources: QlikView may have limited connectivity options to certain data sources, depending on your organization’s technology stack.
- Limited collaboration: QlikView’s collaboration features are somewhat limited compared to other data analysis tools.
- Limited analytics: QlikView’s advanced analytics features may not be as robust as other data analysis tools.
SAP BusinessObjects
SAP BusinessObjects is a business intelligence tool that allows businesses to analyze and visualize their data using interactive dashboards, reports, and charts. The tool provides businesses with insights into their data, including trends, patterns, and outliers.
SAP BusinessObjects has a wide range of features, including data modeling, data visualization, and predictive analytics, that make it a powerful tool for data analysis. It also integrates with various SAP tools, including SAP HANA and SAP ERP, making it easy for businesses to connect to their data.
Here are some key features, pros, and cons of using SAP BusinessObjects:

Features:
- Data integration: SAP BusinessObjects allows users to connect and integrate data from multiple sources, including databases, spreadsheets, and other applications.
- Data modeling: SAP BusinessObjects provides advanced data modeling capabilities to help users create complex data relationships and hierarchies.
- Reporting: SAP BusinessObjects enables users to create customizable reports, dashboards, and scorecards.
- Analytics: SAP BusinessObjects includes advanced analytics features, such as predictive analytics and data visualization.
- Collaboration: SAP BusinessObjects provides collaboration tools for sharing reports, dashboards, and other content with others in the organization.
Pros:
- Scalability: SAP BusinessObjects can handle large datasets and can be scaled up as your business grows.
- Integration with SAP products: SAP BusinessObjects is fully integrated with other SAP products, making it easy to incorporate data from different sources.
- Advanced analytics: SAP BusinessObjects includes advanced analytics features, such as predictive analytics and data visualization.
- Collaboration: SAP BusinessObjects provides robust collaboration tools for sharing and collaborating on reports and dashboards.
- User-friendly interface: SAP BusinessObjects has a user-friendly interface that makes it easy to create and modify reports and dashboards.
Cons:
- Cost: SAP BusinessObjects can be expensive, particularly for larger organizations or for those requiring advanced features.
- Complexity: SAP BusinessObjects can be complex to set up and use, particularly for those with limited technical expertise.
- Limited data manipulation: SAP BusinessObjects’ data manipulation capabilities are somewhat limited compared to other data analysis tools.
- Limited data sources: SAP BusinessObjects may have limited connectivity options to certain data sources, depending on your organization’s technology stack.
- Limited customization: SAP BusinessObjects’ customization options are somewhat limited compared to other data analysis tools.
Points to Consider While Choosing a Business Data Analysis Tool:
- Ease of use: It’s important to choose a tool that is easy to use, especially if you don’t have a dedicated data analyst or IT team. Look for a tool that has an intuitive interface and easy-to-use features.
- Scalability: Consider how the tool will grow with your business. Will it be able to handle larger datasets as your business grows? Can it integrate with other tools and technologies?
- Security: Data security is a critical concern when analyzing sensitive business data. Look for a tool that has robust security features, including data encryption, user authentication, and access control.
- Cost: Business data analysis tools can range in price from free to thousands of dollars per year. Consider your budget and choose a tool that provides the features you need at a price point that works for your business.
- Support: Look for a tool that offers robust support options, including documentation, training materials, and customer support. This can be especially important if you’re new to data analysis and need help getting started.
- Integration: Consider how the tool will integrate with your existing systems and workflows. Will it be easy to connect to your data sources and export data to other tools?
By considering these factors, you can choose the business data analysis tool that best fits your needs and helps you make data-driven decisions that drive growth and success.
In conclusion:
Data analysis is essential for businesses to make informed decisions based on real-time data and analytics. The six best business data analysis tools in 2023 discussed in this blog are Tableau, Power BI, Google Analytics, IBM Cognos Analytics, QlikView, and SAP BusinessObjects. These tools offer a wide range of features, including data modeling, data visualization, and predictive analytics. That makes them powerful tools for data analysis. By leveraging these tools, businesses can gain insights into their data and make informed decisions that drive their success.
Also Read:
- Advanced Solutions for the Lucrative Business Sector
- Tableau v/s Microsoft Power BI – Choose the Best-fit Software for your Organization
- Unleash the Power of Analytics to Make New Opportunities
- How to Make a Decision with the help of a Business Intelligence System to grow your business?
- How Small Businesses Can Use Business Intelligence?